
Pete
Updated:
Created:
SUMMARY
This article explains two alternative methods that can be used to test the performance of Nuke nodes when trying to identify the cause of script slowdowns.MORE INFORMATION
Trying to find out which parts of your Nuke script that are slowing down your playback/render times can be difficult.
To facilitate this process, Nuke provides two alternative methods to profile the performance of nodes in your script, Using Performance Timers and the Profile node.
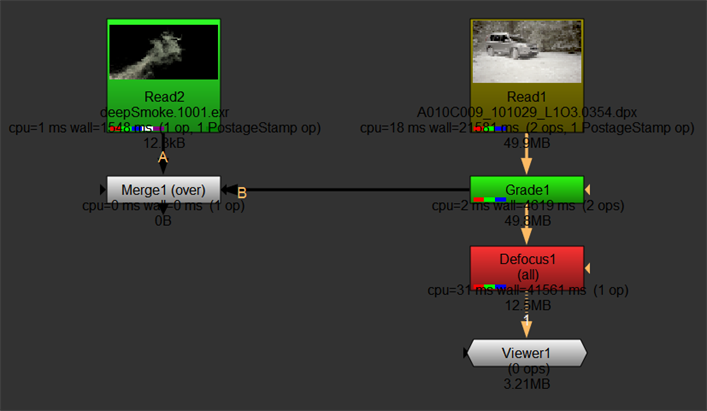
Both methods will provide analytics that can be used to isolate particularly slow nodes and help you optimize your workflow. When profiled, nodes with be color-coded from green through red, where red is a slow node.
You can see from the example below that Defocus is a slow node, whereas Merge is doing no work at all.
Using Performance Timers
Performance Timers mode will allow you to see the analytics of each node and various metrics on the node.
Launching Nuke with Performance Timers enabled
To run Nuke with Performance Timers enabled you can to use the -P flag when launching Nuke. Instructions for how to do this can be found below for each operating system:
Windows:
Open a Command Prompt window and run the following command:
macOS:
Open a Terminal window and run the following command:
Open a Command Prompt window and run the following command:
"C:\Program Files\Nuke16.0v4\Nuke16.0.exe" -P macOS:
Open a Terminal window and run the following command:
/Applications/Nuke16.0v4/Nuke16.0v4.app/Contents/MacOS/Nuke16.0 -P
Linux:
Open a terminal and run the command:
Note: These instructions are based on having Nuke installed in the default location. If this is not the case then the commands will need to be modified accordingly to run from your custom installation location.
Open a terminal and run the command:
/usr/local/Nuke16.0v4/Nuke16.0 -PNote: These instructions are based on having Nuke installed in the default location. If this is not the case then the commands will need to be modified accordingly to run from your custom installation location.
When Nuke is launched with Performance Timers enabled, you can reset, start and stop the timers in the Performance menu in the Nuke UI, as shown below:
Enabling Performance Timers using Python
In any Nuke session, you can also start or stop the Performance Timers by running the following commands in the Script Editor:
nuke.startPerformanceTimers()nuke.stopPerformanceTimers()More information about these commands can be found in our documentation below:
startPerformanceTimers: https://learn.foundry.com/nuke/developers/latest/pythondevguide/_autosummary/nuke.startPerformanceTimers.html
stopPerformanceTimers: https://learn.foundry.com/nuke/developers/latest/pythondevguide/_autosummary/nuke.stopPerformanceTimers.html
Information reported while in using Performance Timers
Performance Timers are enabled, each node will report the following information:
• CPU - The time that the CPU spent executing the processing code, in microseconds, aggregated over all CPU threads.
For example, with multi-threaded processing this is typically much larger than the wall time. If the average CPU time per thread (CPU divided by the number of threads used) is much shorter than the wall time, this suggests the CPU threads have spent a lot of time not executing code and perhaps waiting on locks, which could indicate a performance problem.
NOTE: On macOS and Windows, the CPU time is not currently accurate. On macOS, the CPU value is always similar to the wall time.
• wall - The time taken as it would be measured by a clock on the wall - the actual time you have to wait for the processing to complete. The wall time is also measured in microseconds.
• ops - The number of operators called in the node. Operators are Nuke's building blocks that perform certain tasks. Nodes can contain one or more ops.
For example, when a node needs to resize something it would use a Transform op rather than an implementation of its own to do the same thing.
• memory - The total amount of system memory used by the node.
With Nuke launched in Performance Profiling mode, you can reset, start and stop the timers in the Performance menu in the Nuke UI, as shown below:
Profile node
In Nuke 11.1 we added the Profile node, which allows users the ability to calculate the metrics of a node tree at the point the Profile node is placed.
In the Properties of the Profile node, you can press open profile panel to access the controls for profiling your Nuke script:
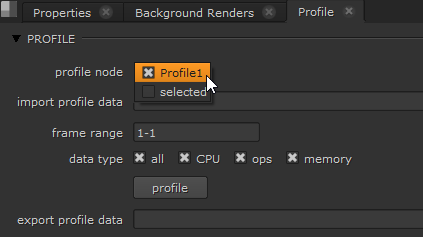
To profile the Nuke script, connect the Profile node to the part of the script you want to profile, enter the selected frame range and data type then click profile.
Once the data is collected, the Profile panel will show the data collected in chart based upon percentage use, shown below:
Note: For more information on filtering this data, please refer to the Filtering Profile Data documentation
Difference between methods
While the Profile node does provide quite a few new features such as charts and other GUI based diagnostics, it calculates performance based upon percent-based analytics rather than the timer-based analytics that the Performance timers use.
Additional Information
More information regarding both methods can be found respectively within either the Performance Profiling or Profile node documentation.
We're sorry to hear that
Please tell us why